Evidence

What the evidence bench is showing.

Behind the advisory work sits an evidence engine that reads any region on the same rules: invention, research, jobs, capital, companies, and the land around it, for every US metro at once. Most of what it produces belongs to the clients who commissioned it. These pages share what can be shared: public data, the method, and what the research literature says.

The land

Big is not the same as broad.

A new seed, chemistry, biological, or machine is proven in the field before it is proven in the market. How much cropland sits within a day's drive tells you how big the nearby market is. How many soils and crops it covers tells you how many conditions a product can be tested against in its first seasons.

The two do not line up. The western Corn Belt hubs hold the most cropland. The California hubs sit on the widest range of soils but on far less land. A few hubs in the middle of the country, among them St. Louis, Springfield, Champaign-Urbana, and Indianapolis, combine large acreage with diverse soils.
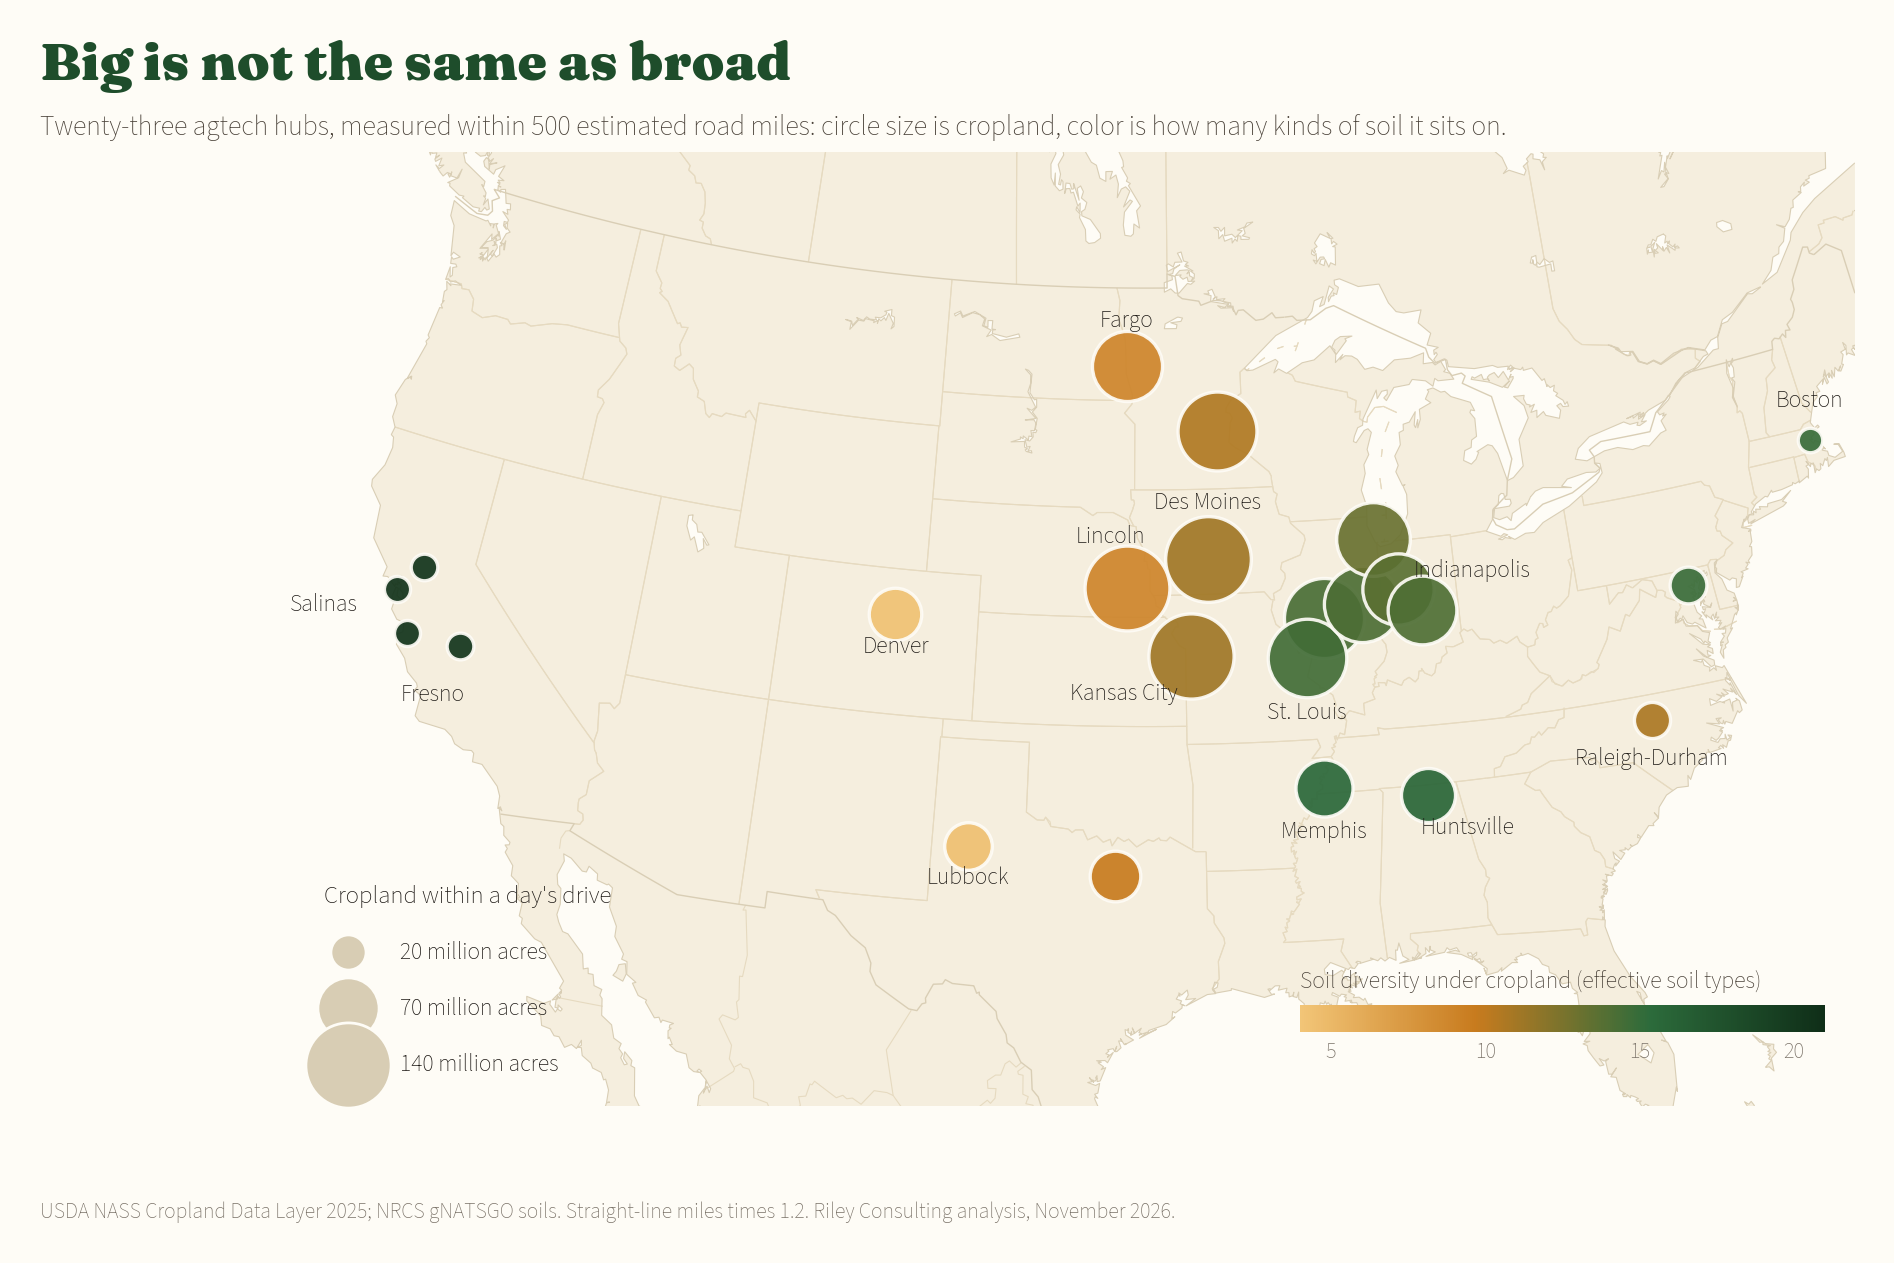
Map of 23 agtech hubs: circle size shows cropland within 500 estimated road miles, color shows soil diversity

USDA NASS Cropland Data Layer 2025 and NRCS gNATSGO soils, within 500 estimated road miles (straight-line miles times 1.2).

How fast the test bed widens.

Within 50 miles, Fresno already has more than twenty crops grown at scale. Midwestern hubs start with fewer than ten and catch up only toward 500 miles, where several pass fifty. For a company planning trials, that is the difference between one region and a road trip.
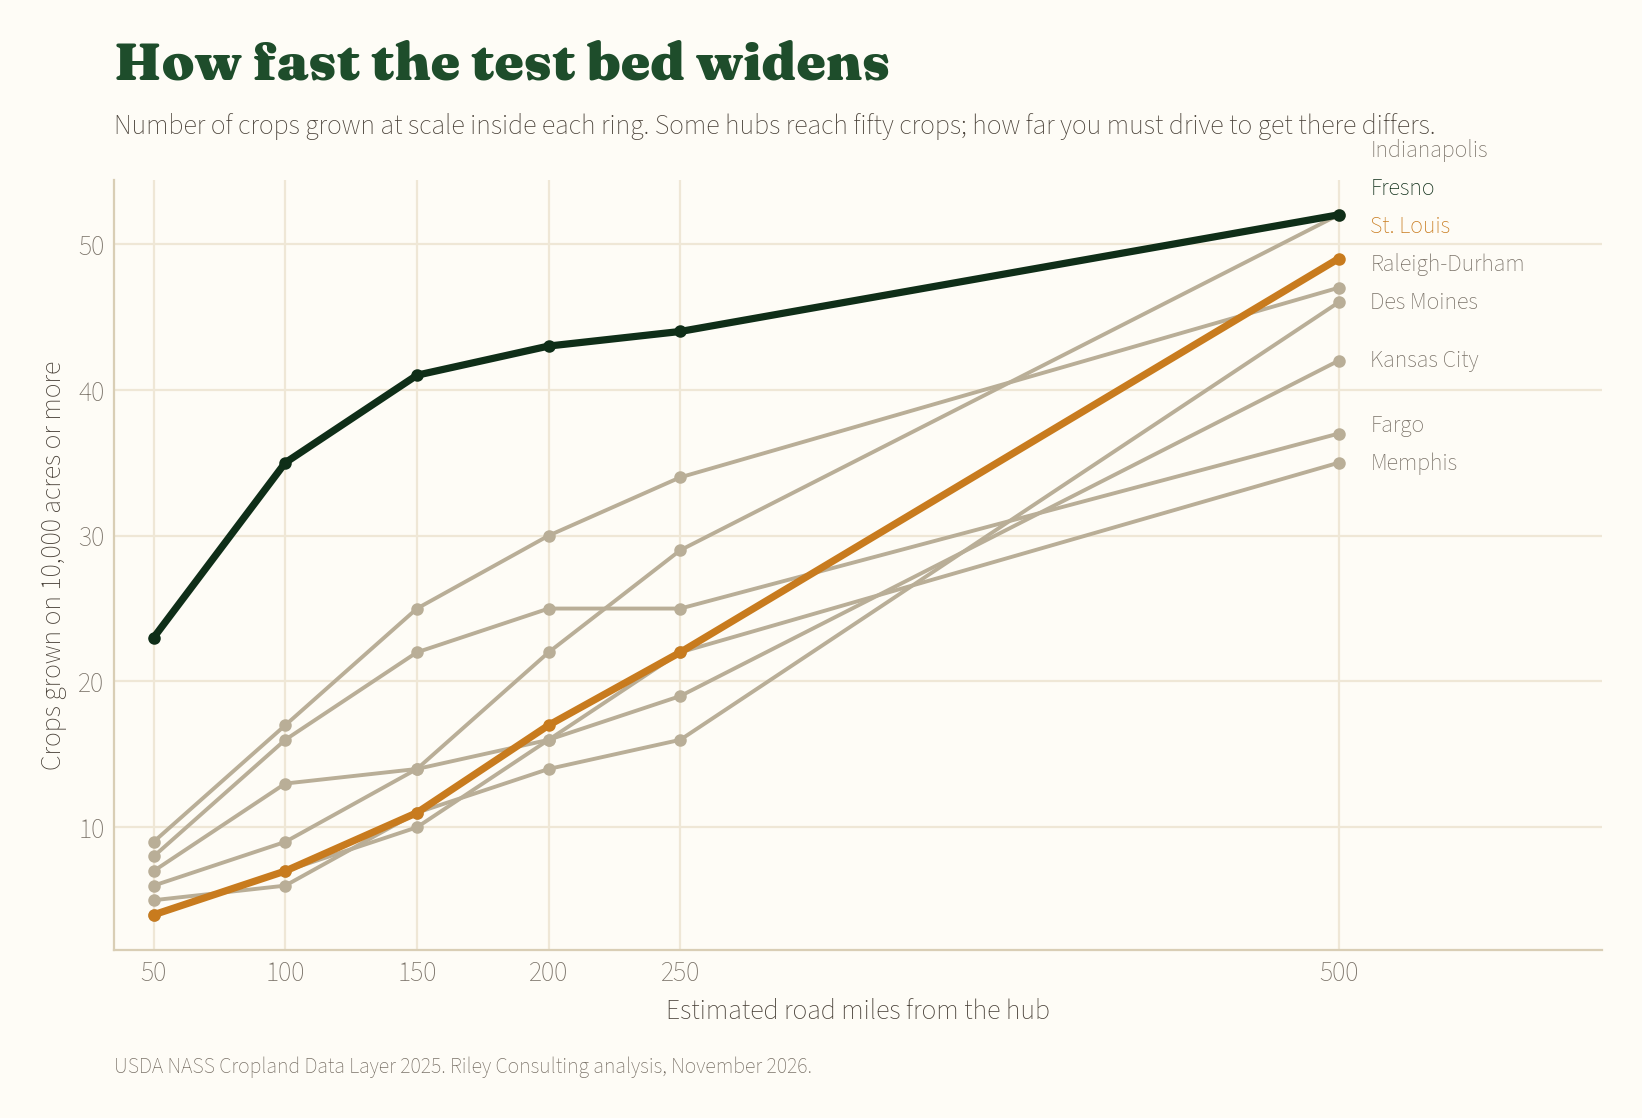
Line chart of crops grown on 10,000 acres or more within rings of 50 to 500 miles for eight hubs

Crops grown on 10,000 acres or more inside each ring. USDA NASS Cropland Data Layer 2025.
The method

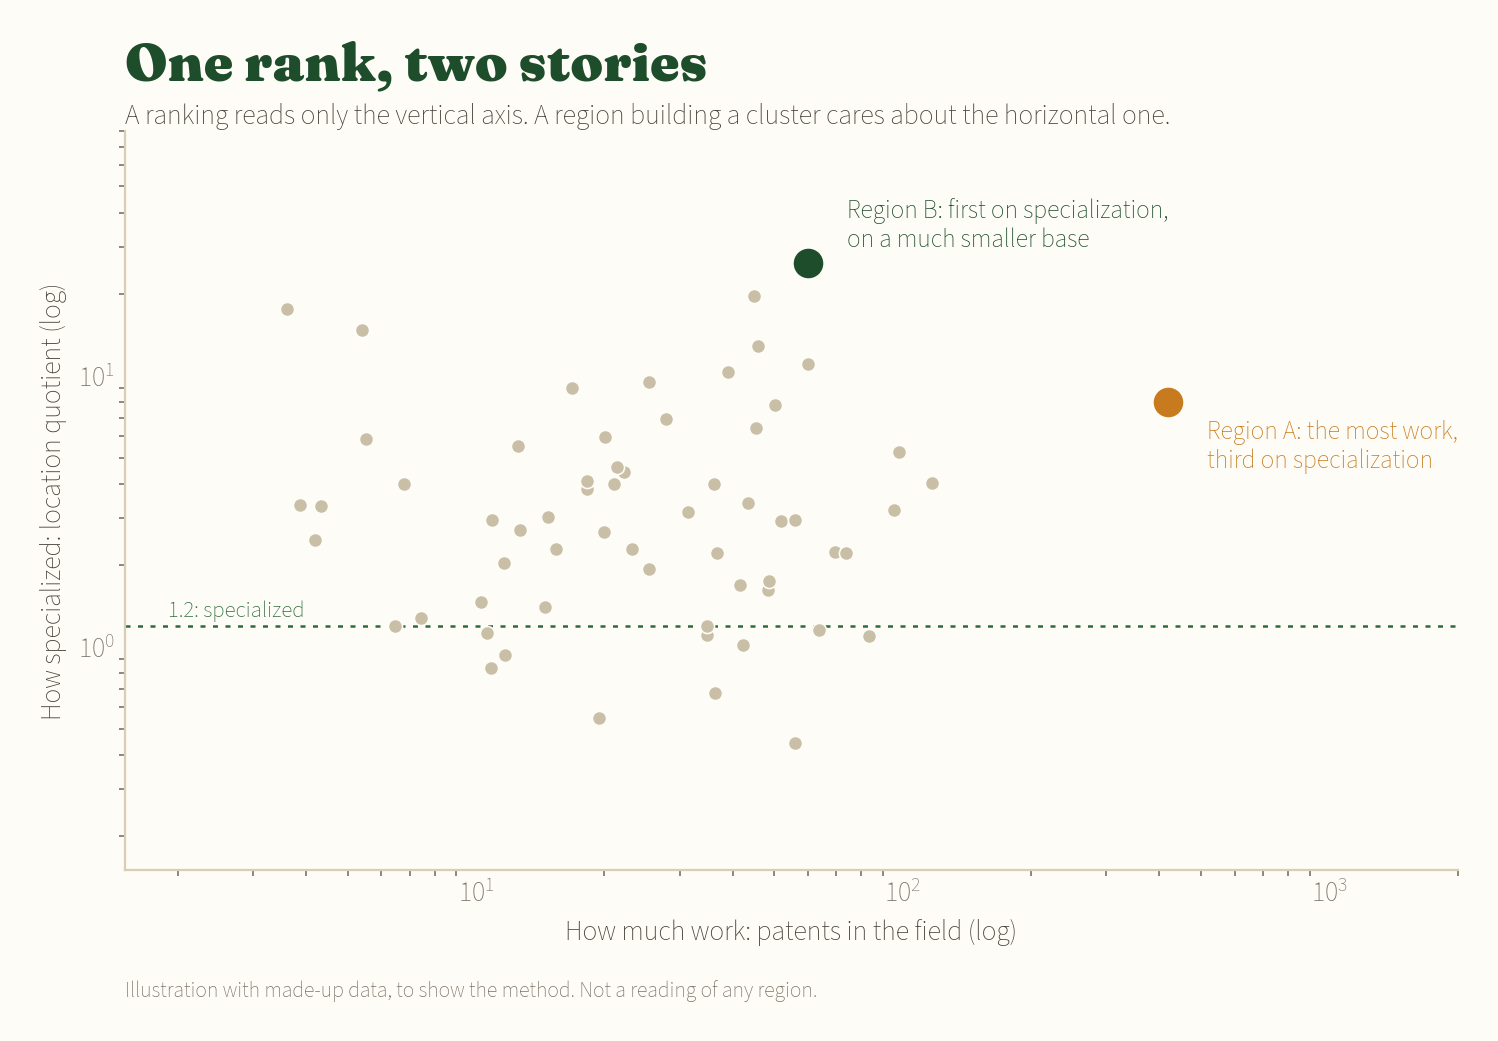
One rank, two stories.

A league table answers one question: how specialized is a place? It hides a second: how much work is actually done there? A university town with a small base can read far more specialized than a large region doing several times the work. Both readings are true, and a region deciding where to build needs both on the same page.

Illustration: scatter of specialization against volume for made-up regions

Illustration with made-up data, to show the method.

The anchor, and the bench behind it.

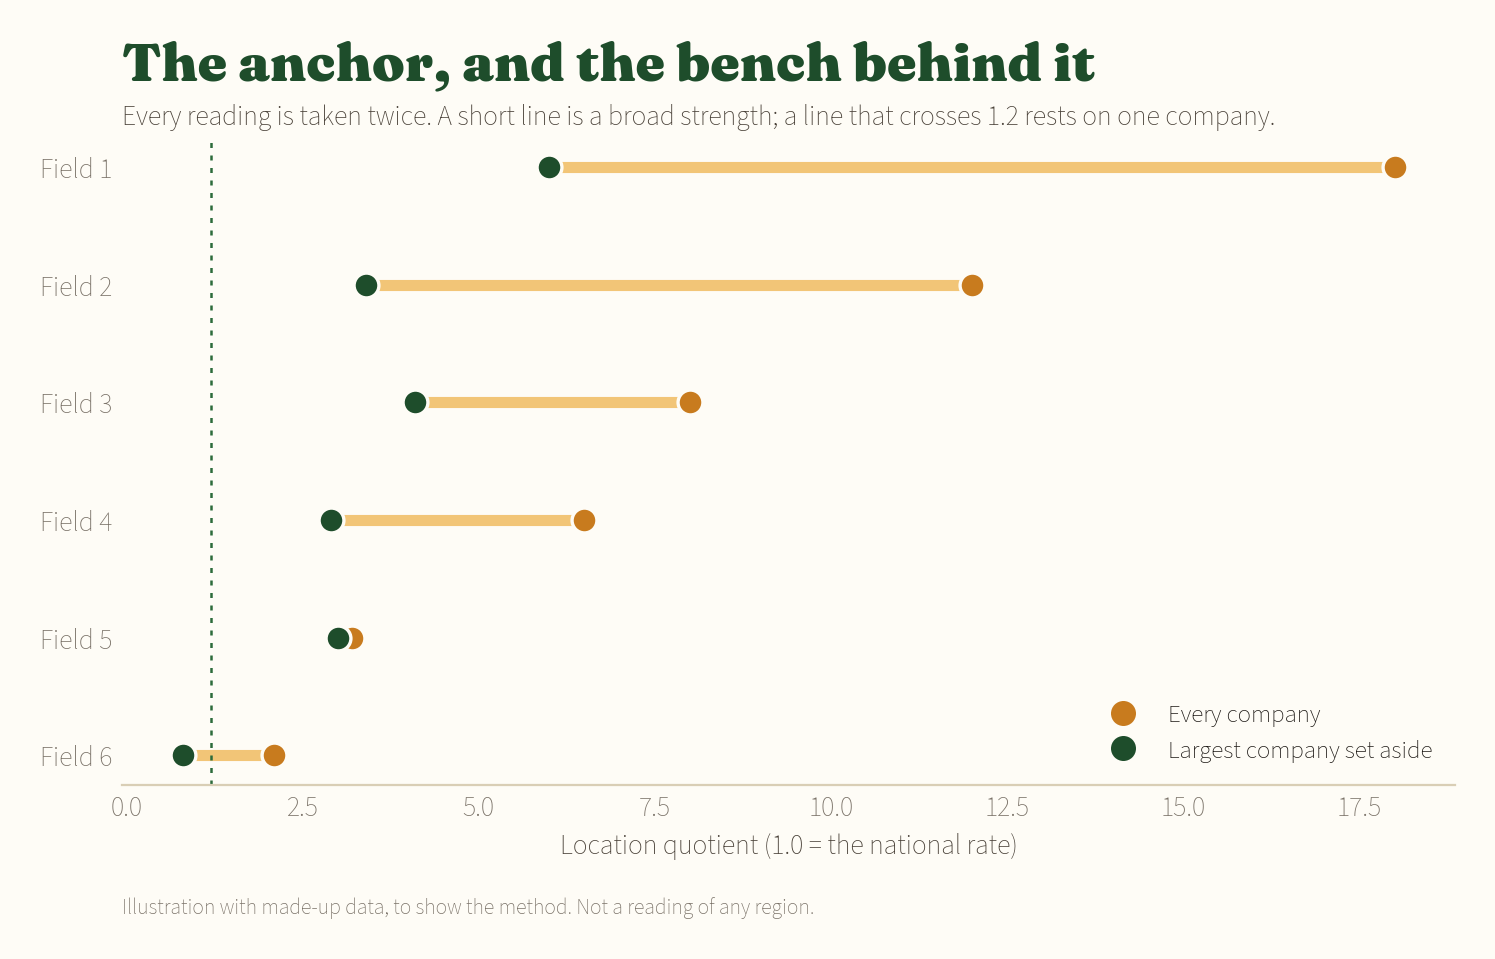
Most agricultural regions have one company that holds a large share of their patents. So every reading is taken twice: with every company, and with the largest one set aside, in the home region and in every comparison region alike. A strength that holds without its anchor rests on a broad base. One that falls away is a question about depth, not a weakness to hide.

Illustration: readings with every company and with the largest company set aside

Illustration with made-up data, to show the method.

Three more rules travel with every number: a reading needs enough patents and enough independent owners before it is shown; a missing reading is labeled with a word, never drawn as a zero; and areas are never added into one score.

The research

Six things the literature says that regions forget.

Read alongside the data, these change what a region should measure and what it should ask.

Neighbors add strength.

Industries in strong clusters grow faster in jobs, wages, and patenting, and they also gain from strong related clusters in nearby regions. A region's real boundary is often wider than its metro line.

Delgado, Porter, and Stern, Research Policy, 2014

An anchor helps a region use its own research.

A large, local, research-heavy company makes it more likely that local university research is picked up by local industry. The useful question is how deep the bench behind the anchor is.

Agrawal and Cockburn, International Journal of Industrial Organization, 2003

Acquisitions move inventors.

After acquisitions, many of the acquired company's most productive inventors leave or patent much less. Whether a region keeps that talent is something you can measure, not just debate.

Ernst and Vitt, R&D Management, 2000

Spinouts build clusters.

Detroit became the auto capital mainly through spinoffs from a few early leaders, more than through the general benefits of being close together. Who leaves a big company, and where they start the next one, matters.

Klepper, Management Science, 2007

Patents are one lens.

Patent data is broad and consistent across places, and its limits are well known. It records invention, not products, sales, or adoption, so it has to be read beside jobs, companies, and capital.

Nagaoka, Motohashi, and Goto, Handbook of the Economics of Innovation, 2010

Shared measurement needs a backbone.

Regions that move together share an agenda, a common set of measures, and an organization that keeps them current. The evidence is only useful if someone owns it every year.

Kania and Kramer, Stanford Social Innovation Review, 2011

What it can do

Put your region, or your product, on the same page.

Start a conversation →

Public data only on this page. Client findings stay in the client's private room unless the client chooses otherwise. Sources: USDA NASS Cropland Data Layer 2025; NRCS gNATSGO; the research cited above. Analysis by Riley Consulting LLC, November 2026.